dotools_py.pl.volcano_plot#
- dotools_py.pl.volcano_plot(df, lfc_col='log2fc', pval_col='padj', gene_col='GeneName', figsize=(7, 5), ax=None, title='', legend_loc='right', legend_ncols=1, path=None, filename='Volcano.svg', show=True, pval_lim=2e-10, lfc_lim=(-6, 6), lfc_cut=0.25, pval_cut=0.05, mygenes=None, clean=True, dot_size=3, topn=10, textprops=None, **kwargs)[source]#
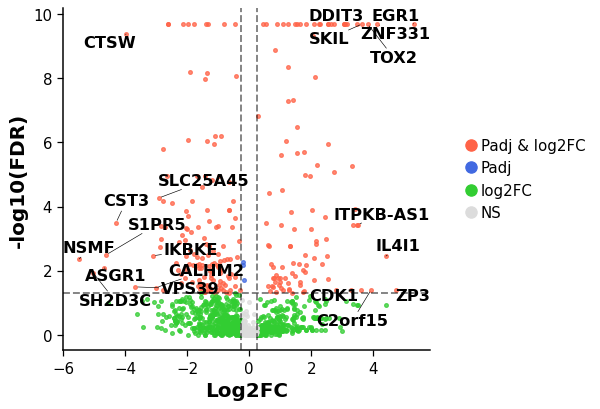
Generate a volcano plot.
Genes will be colored differently depending on the p-value (Pval) and logfoldchange (LFC):
Genes Pval < pval_cut & LFC > lfc_cut: Red.
Genes Pval < pval_cut & LFC < lfc_cut: Blue.
Genes Pval > pval_cut & LFC > lfc_cut: Green.
Genes Pval > pval_cut & LFC < lfc_cut: Gray.
If no genes are provided (
mygenes) the top 10 genes with highest and lowest LFC that are significant will be indicated.- Parameters:
- df
DataFrame pandas dataframe with DGE. Should have at least 3 columns (Genes, Pvalue, Logfoldchange).
- lfc_col
str(default:'log2fc') name of the column that has the logfoldchanges.
- pval_col
str(default:'padj') name of the column that has the Pvals.
- gene_col
str(default:'GeneName') name of the column that has the gene names.
- path
str|PathLike[str] |Path(default:None) path where to save the figure.
- filename
str(default:'Volcano.svg') name of the file.
- pval_lim
float(default:2e-10) Y-axis limit. Genes with a < p-value will be set to this value.
- lfc_lim
tuple(default:(-6, 6)) X-axis limit. Genes with a > LFC will be ignored.
- title
str(default:'') a text to add as the title of the plot.
- figsize
tuple[int,int] (default:(7, 5)) size of the plot.
- ax
Axes(default:None) matplotlib axis.
- legend_loc
Literal['top','bottom','right'] (default:'right') location of the legend.
- legend_ncols
int(default:1) number of columns for the legend.
- lfc_cut
float(default:0.25) significance threshold for the LFC.
- pval_cut
float(default:0.05) significance threshold for the P-value.
- mygenes
list|None(default:None) list of genes to be annotated.
- clean
bool(default:True) remove genes with Pval == 1 and LFC > lfc_lim.
- dot_size
float(default:3) size of the dots.
- topn
int(default:10) if mygenes is None. The top 10 positive and negative genes are plotted.
- textprops
dict(default:None) properties of the gene labels (See plt.text)
- show
bool(default:True) if set to true, return axis.
- df
- Return type:
- Returns:
Depending on
show, returns the plot if set toTrueor a dictionary with the axes.
Example
import dotools_py as do
adata = do.dt.example_10x_processed()
do.tl.rank_genes_groups(adata,  'condition', method='wilcoxon', tie_correct=True, pts=True)
table = do.get.dge_results(adata)
table = table[table.group == 'disease']
do.pl.volcano_plot(table, 'log2fc', 'padj', 'GeneName')