dotools_py.pl.cell_composition#
- dotools_py.pl.cell_composition(adata, annot_key, condition_key, batch_key, annot_order=None, condition_order=None, subset_cells=None, figsize=(5, 6), ax=None, title='', title_fontproperties=None, xticks_rotation=None, legend_title='', legend_fontproperties=None, legend_ncols=1, path=None, filename='Proportions.svg', show=True, covariates=None, pval_cutoff=0.05, transform='logit', sep=0.5, bar_width=0.2, linewidth=0.9, add_total_ncell=True, get_props=False, random_state=0, **kwargs)[source]#
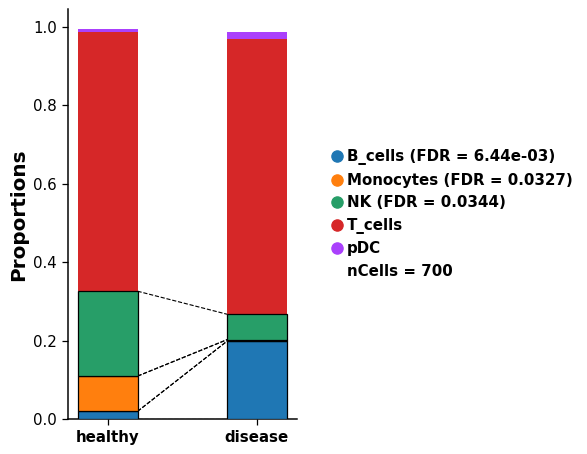
Stacked barplot showing changes in cell-type proportions.
Generates a stacked barplot to show changes in cell-type proportions between different conditions. Significant changes in cell proportions between conditions will be tested with
scanpro <https://github.com/loosolab/scanpro>and will be indicated by a discontinued line. The significant p-value/FDR will be indicated in the legend.- Parameters:
- adata
AnnData Annotated data matrix.
- annot_key
str Name of a categorical column in
adata.obswith the annotation to test for significant differences.- condition_key
str Name of a categorical column in
adata.obsto group by.- batch_key
str Name of a categorical column in
adata.obswith the batch information.- annot_order
list|None(default:None) Order for the categories in
adata.obs[annot_key]- condition_order
list|None(default:None) Order for the categories in
adata.obs[condition_key]- subset_cells
list|None(default:None) Only show a subset of groups in
adata.obs[annot_key]. The test is applied over all cells.- figsize
tuple(default:(5, 6)) Figure size, the format is (width, height).
- ax
Axes|None(default:None) Matplotlib axes to use for plotting. If not set, a new figure will be generated.
- title
str(default:'') Title for the figure.
- title_fontproperties
Dict[Literal['size','weight'],str|int] (default:None) Dictionary which should contain ‘size’ and ‘weight’ to define the fontsize and fontweight of the title of the figure.
- xticks_rotation
int(default:None) Order for the categories in
adata.obs[condition_key].- legend_title
str(default:'') Title for the legend.
- legend_fontproperties
Dict[Literal['size','weight'],str|int] (default:None) Dictionary which should contain ‘size’ and ‘weight’ to define the fontsize and fontweight of the title of the legend.
- legend_ncols
int(default:1) Number of columns for the legend.
- path
str|PathLike[str] |Path(default:None) Path to the folder to save the figure.
- filename
str(default:'Proportions.svg') Name of file to use when saving the figure.
- show
bool(default:True) If set to
False, returns a dictionary with the matplotlib axes.- covariates
list|None(default:None) Additional covariates for the model. See scanpro.
- pval_cutoff
float(default:0.05) P-val/FDR cutoff.
- transform
str(default:'logit') Method of transformation of proportions.
- sep
float(default:0.5) Separation between bars.
- bar_width
float(default:0.2) Bars width.
- linewidth
float(default:0.9) Thickness of the lines connecting significant bars.
- add_total_ncell
bool(default:True) Add the total number of cells in the dataset.
- get_props
bool(default:False) If set to
True, returns a dataframe with the cell proportions.- random_state
int(default:0) seed for random number generator.
- kwargs
Additional arguments pass to scanpro().
- adata
- Return type:
- Returns:
Depending on
show, returns the plot if set toTrueor a dictionary with the axes.
Example
import dotools_py as do
adata = do.dt.example_10x_processed()
do.pl.cell_composition(adata, "annotation", "condition", "batch", condition_order=["healthy", "disease"], transform="arcsin")