dotools_py.pl.layers#
- dotools_py.pl.layers(adata, color, key_layers, ncols=4, normalise=False, show=True, figsize=(15, 8), path=None, filename='Layers.pdf', **kwargs)[source]#
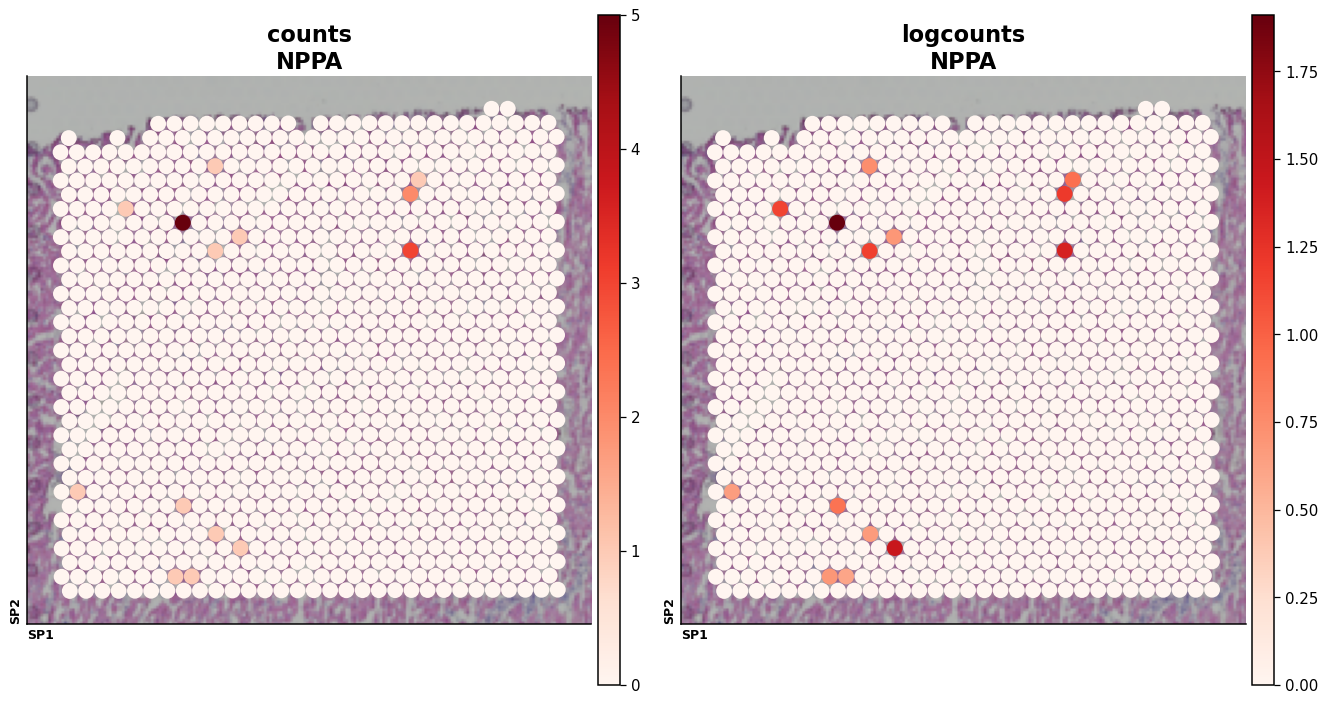
Plot several layers.
Plot different layers in subplots. Useful for deconvolution analysis with celltype counts in layers.
- Parameters:
- adata
AnnData annotated data matrix.
- color
str var_names or obs column to plot.
- key_layers
str|list layers to plot.
- ncols
int(default:4) number of columns in the plot.
- normalise
bool(default:False) do log-normalization on the layers.
- show
bool(default:True) if set to False, return axis.
- figsize
tuple(default:(15, 8)) Figure size, the format is (width, height).
- path
str|PathLike[str] |Path(default:None) Path to the folder to save the figure.
- filename
str(default:'Layers.pdf') Name of file to use when saving the figure.
- kwargs
additional arguments for sc.pl.spatial.
- adata
- Return type:
- Returns:
None or plt.axes.
Examples
import dotools_py as do
adata = do.dt.example_visium_processed()
do.pl.layers(adata, "NPPA", key_layers= ['counts', 'logcounts'], img_key="lowres")