dotools_py.pl.umap#
- dotools_py.pl.umap(adata, color, split_by=None, catgs_order=None, figsize=(6, 5), ax=None, ncols=4, title=None, title_fontproperties=None, share_legend=False, vmax=None, spacing=(0.3, 0.2), path=None, filename='Umap.svg', show=True, labels=None, labels_fontproperties=None, labels_repel=None, **kwargs)[source]#
Scatter plot in UMAP basis.
This function builds on sc.pl.umap() and add extra functionalities like.
- Parameters:
- adata
AnnData Annotated data matrix.
- color
str|list Keys for annotations of observations/cells or variables/genes.
- split_by
str|None(default:None) Categorical column in
adata.obsto split by.- catgs_order
list(default:None) Order of the categories when splitting by a categorical column.
- figsize
tuple[float,float] (default:(6, 5)) Figure size, the format is (width, height).
- ax
Axes(default:None) Matplotlib axes to use for plotting. If not set, a new figure will be generated.
- ncols
int(default:4) Number of columns per row.
- title
str(default:None) Title for the figure.
- title_fontproperties
Dict[Literal['size','weight'],str|int] (default:None) Dictionary which should contain ‘size’ and ‘weight’ to define the fontsize and fontweight of the title of the figure.
- share_legend
bool(default:False) Set a common legend when plotting multiple values, it will automatically scale if plotting continuous values like gene expression if
vmaxis not specified.- vmax
float|str|None(default:None) The value representing the upper limit of the color scale.
- spacing
tuple(default:(0.3, 0.2)) Spacing between subplots (height, width) padding between plots.
- path
str|PathLike[str] |Path(default:None) Path to the folder to save the figure.
- filename
str(default:'Umap.svg') Name of file to use when saving the figure.
- show
bool(default:True) If set to
False, returns a dictionary with the matplotlib axes.- labels
str(default:None) Column in
adata.obswith categorical values to add to the plot.- labels_fontproperties
Dict[Literal['size','weight'],str|int] (default:None) Dictionary which should contain ‘size’ and ‘weight’ to define the fontsize and fontweight of the labels.
- labels_repel
dict(default:None) Additional arguments pass to
adjust_text <https://adjusttext.readthedocs.io/en/latest/>_.- kwargs
Additional parameters pass to sc.pl.umap().
- adata
- Return type:
- Returns:
Depending on
show, returns the plot if set toTrueor a dictionary with the axes.
Example
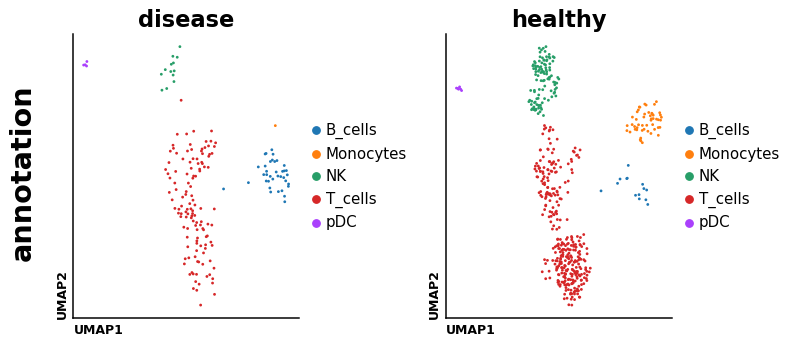
Visualize a categorical column
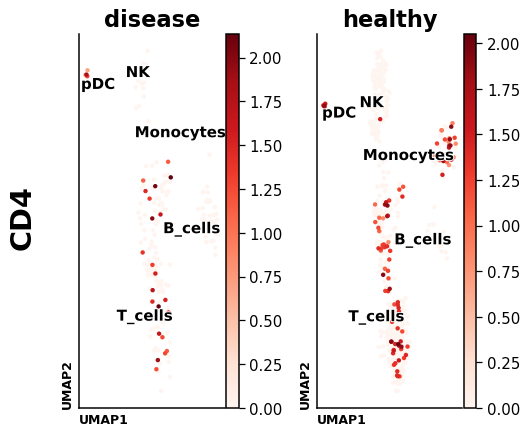
import dotools_py as do
adata = do.dt.example_10x_processed()
do.pl.umap(adata, 'annotation', split_by='condition', ncols=2, figsize=(9, 4), size=20)
do.pl.umap(adata, 'CD4', split_by='condition',  size=50, labels='annotation', cmap='Reds')

or the expression of a gene
do.pl.umap(adata, 'CD4', split_by='condition', size=50, labels='annotation', cmap='Reds')