dotools_py.pl.lineplot#
- dotools_py.pl.lineplot(adata, x_axis, features, hue=None, figsize=(6, 5), ax=None, palette='tab10', title=None, xticks_rotation=None, xticks_order=None, ylim=None, ylabel='LogMean(nUMI)', legend_title=None, legend_loc='right', legend_repel=None, path=None, filename='lineplot.svg', show=False, estimator='logmean', markersize=8)[source]#
Lineplot for AnnData.
- Parameters:
- adata
AnnData Annotated data matrix
- x_axis
str Name of a categorical column in
adata.obsto groupby.- features
str|list A valid feature in
adata.var_namesor column inadata.obswith continuous values.- hue
Union[str,Literal['features']] (default:None) Name of a second categorical column in
adata.obsto use additionally to groupby. If severalfeaturesare provided, set tofeatures.- figsize
tuple(default:(6, 5)) Figure size, the format is (width, height).
- ax
Axes(default:None) Matplotlib axes to use for plotting. If not set, a new figure will be generated.
- palette
str|dict(default:'tab10') String denoting matplotlib colormap. A dictionary with the categories available in
adata.obs[x_axis]oradata.obs[hue]if hue is not None can also be provided. The format is {category:color}.- title
str(default:None) Title for the figure.
- xticks_rotation
int|None(default:None) Rotation of the X-axis ticks.
- xticks_order
list(default:None) Order for the categories in
adata.obs[x_axis].- ylim
tuple[int,int] (default:None) Set limit for Y-axis.
- ylabel
str(default:'LogMean(nUMI)') Label for the Y-axis.
- legend_title
str(default:None) Title for the legend.
- legend_loc
Literal['right','axis'] (default:'right') Location of the legend.
- legend_repel
dict(default:None) Additional arguments pass to
adjust_text <https://adjusttext.readthedocs.io/en/latest/>_.- path
str|PathLike[str] |Path(default:None) Path to the folder to save the figure.
- filename
str(default:'lineplot.svg') Name of file to use when saving the figure.
- show
bool(default:False) If set to
False, returns a dictionary with the matplotlib axes.- estimator
Literal['logmean','mean'] (default:'logmean') If set to
logmean, the mean will be calculated after undoing the log. The returned mean expression is also represented in log-space.- markersize
int(default:8) Radius of the markers
- adata
- Return type:
- Returns:
Depending on
show, returns the plot if set toTrueor a dictionary with the axes.
Example
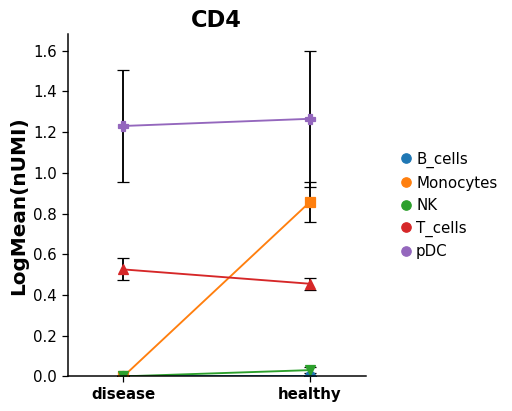
Plot the expression for a gene across several groups.
import dotools_py as do
adata = do.dt.example_10x_processed()
do.pl.lineplot(adata, 'condition', 'CD4', hue = 'annotation')
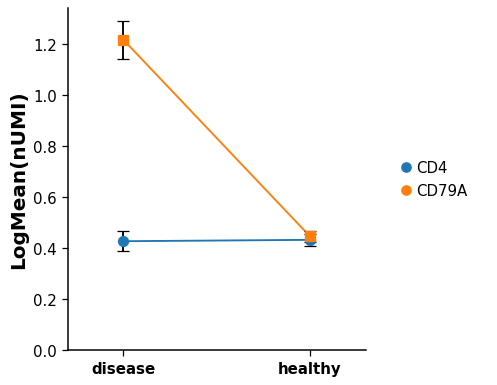
Plot the distribution of several genes at the same time.
do.pl.lineplot(adata, 'condition', ['CD4', 'CD79A'], hue = 'features')