dotools_py.pl.split_embedding#
- dotools_py.pl.split_embedding(adata, split_by, figsize=(6, 5), title_fontproperties=None, ncols=4, path=None, filename='UMAP.svg', show=True, basis='X_umap', visium=False, sp_size=1.5, **kwargs)[source]#
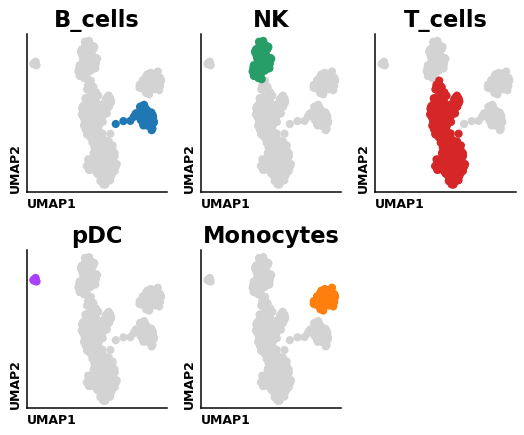
Scatter plot splitting categorical data in an embedding.
This function takes a categorical column in
adata.obsand generate a plot of subplots highlighting the different categories of the obs column.- Parameters:
- adata
AnnData Annotated data matrix.
- split_by
str Column in
adata.obsto split by.- figsize
tuple[float,float] (default:(6, 5)) Figure size, the format is (width, height).
- title_fontproperties
Dict[Literal['size','weight'],str|int] (default:None) Dictionary which should contain ‘size’ and ‘weight’ to define the fontsize and fontweight of the title of the figure.
- ncols
int(default:4) Number of subplots per row.
- path
str|PathLike[str] |Path(default:None) Path to the folder to save the figure.
- filename
str(default:'UMAP.svg') Name of file to use when saving the figure.
- show
bool(default:True) If set to
False, returns a dictionary with the matplotlib axes.- basis
str(default:'X_umap') Embedding to use, default UMAP.
- visium
bool(default:False) Set to
Trueif you anndata has visium data.- sp_size
float(default:1.5) Spot size when plotting visium data.
- kwargs
Additional arguments for sc.pl.embedding() or sc.pl.spatial() if visium is True.
- adata
- Return type:
- Returns:
Depending on
show, returns the plot if set toTrueor a dictionary with the axes.
Example
import dotools_py as do
adata = do.dt.example_10x_processed()
do.pl.split_embedding(adata, 'annotation', ncols=3)