dotools_py.bm.eval_integration#
- dotools_py.bm.eval_integration(adata_post, adata_pre, batch_key, annotation_key, use_rep, figsize=(6, 5), ax=None, palette=None, cmap='tab10', path=None, filename=None, title=None, title_fontsize=15, title_legend=None, legend_fontsize=12, show=True, scale=True, compute_metrics='all')[source]#
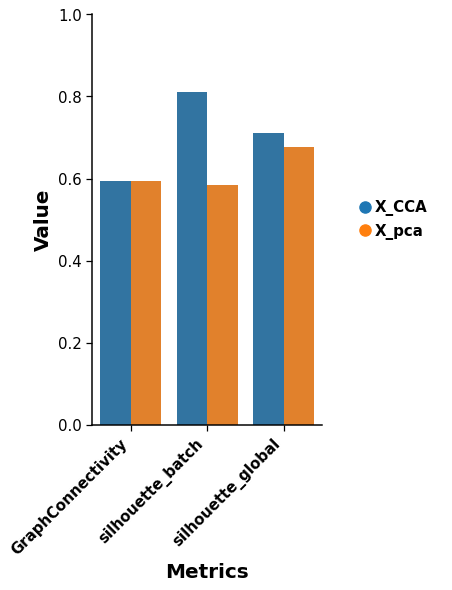
Evaluate the integration.
This function calculate several metrics to evaluate how well the integration worked. The batch correction metrics values are scaled by default between 0 and 1, in which larger scores represent better batch removal. It will generate a barplot to summarize all the metrics.
- Parameters:
- adata_post
AnnData Annotated data matrix after integration.
- adata_pre
AnnData Annotated data matrix before integration.
- batch_key
str Column in adata.obs with batch information.
- annotation_key
str Column in adata.obs with clustering information.
- use_rep
str|list Key(s) in adata.obsp with the embedding generated from the integration.
- figsize
tuple(default:(6, 5)) Figure size, the format is (width, height).
- ax
Axes(default:None) Matplotlib axes to use for plotting. If not set, a new figure will be generated.
- palette
dict(default:None) Dictionary with the embedding names (keys) and the color as values.
- cmap
str(default:'tab10') Matplotlib colormap to use for the different embeddings.
- path
str(default:None) Path to the folder to save the figure.
- filename
str(default:None) Name of file to use when saving the figure.
- title
str(default:None) Title for the figure.
- title_fontsize
int(default:15) Size of the title font.
- title_legend
str(default:None) Title of the legend.
- legend_fontsize
int(default:12) Size of the legend title font.
- show
bool(default:True) If set to
False, returns a dictionary with the matplotlib axes.- scale
bool(default:True) If set to
Truescale score between 0 and 1.- compute_metrics
Union[Literal['GraphConnectivity','kBET','pcr_comparison','silhouette_batch','silhouette_global','all'],list] (default:'all') List of the metrics to compute. Set to “all” to compute all metrics.
- adata_post
- Return type:
- Returns:
Returns a
pd.Dataframewith the metrics for each embedding inuse_rep. If show is set toFalseit returns a tuple with the first element being the DataFrame with the metrics and the second a dictionary with the matplotlib axes for the figure.
Examples
Evaluate the metrics across different integration methods.
import dotools_py as do
adata = do.dt.example_10x_processed()
adata_unintegrated = adata.copy()
del adata_unintegrated.obsm
database = do.bm.eval_integration(adata_post=adata, adata_pre=adata_unintegrated, batch_key="batch", annotation_key="annotation", use_rep=["X_CCA", "X_pca"], compute_metrics = ["GraphConnectivity", "silhouette_batch", "silhouette_global"] )