dotools_py.pl.dotplot#
- dotools_py.pl.dotplot(adata, x_axis, features, y_axis=None, layer=None, x_categories_order=None, y_categories_order=None, subset_adata=False, logcounts=True, expression_cutoff=0.0, mean_only_expressed=False, z_score=None, cmap='Reds', vmax=None, vmin=None, vcenter=None, size_legend_title='Fraction of cells\\nin group (%)', color_legend_title='LogMean(nUMI)\\nin group', feature_fontsize=15, xticks_rotation=90, ax=None, figsize=(8, 4), path=None, filename='Dotplot.svg', smallest_dot=0.0, largest_dot=200.0, show=True, swap_axes=True, rect_height=None, size_exponent=1.5, edge_lw=0.2, edge_color='black', dot_max=None, dot_min=None, add_stats=None, stats_type='star', df_pvals=None, square_x_size=None, star_x_size=25, test='wilcoxon', correction_method='benjamini-hochberg', pval_cutoff=0.05, log2fc_cutoff=0.0, set_equal_aspect=False, var_group_rotation=0, var_group_offset=0.75, **kwargs)[source]#
Makes a 2d dotplot or 3d dotplot.
- There are two type of visualization:
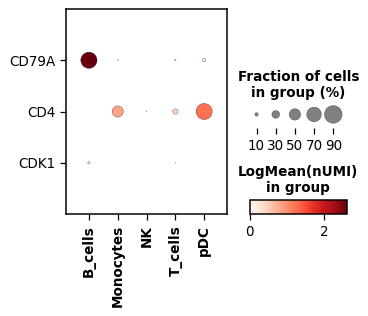
- 2d dotplot: X_axis shows
x_axiscategories and Y_axis thefeatures. The color represents the logarithmize mean nUMI and the size of the dots the fractions of cells expressing the feature.
- 2d dotplot: X_axis shows
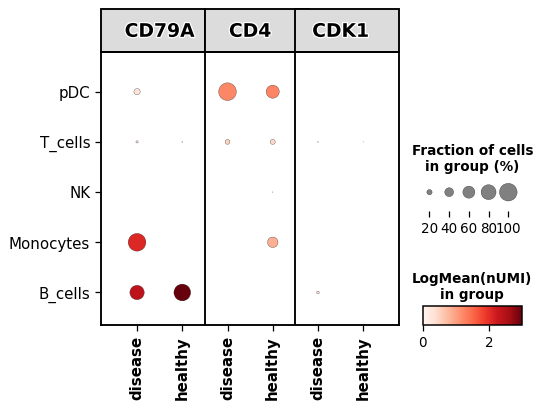
- 3d dotplot: X_axis shows
x_axiscategories and Y_axis showsy_axiscategories. For each feature the x_axiscategories will be duplicated, to show how is the expressing across 2 categorical columns in.obs. The color represents the logarithmize mean nUMI and the size the fraction of cells expressing the feature.
- 3d dotplot: X_axis shows
Note
The 2d dotplot implementation allows for standard scaling while the 3d implementation allows for Z-score scaling.
- Parameters:
- adata
AnnData annotated data matrix.
- x_axis
str .obscolumn to group-by.- features
str|list|dict .var_namesto show mean values.- y_axis
str(default:None) .obscolumn to group-by in the other axis.- layer
str|None(default:None) layer of the AnnData to use.
- x_categories_order
list|None(default:None) order of the categories in x_axis.
- y_categories_order
list|None(default:None) order of the categories in y_axis.
- subset_adata
bool(default:False) subset anndata if less x_categories_order and y_categories_order are provided.
- logcounts
bool(default:True) the expression values provided are log-counts.
- expression_cutoff
float(default:0.0) expression cutoff used for binarizing the gene expression and determining the fraction of cells expressing a given feature. A gene is expressed only if the expression value is greater than this threshold.
- mean_only_expressed
bool(default:False) if True, gene expression is averaged only over the cells expressing the given gene.
- z_score
str|None(default:None) apply z_score transformation. Possible values: x_axis, y_axis or None. Only can be used when y_axis is provided. Use standard_scale (group or var) if only x_axis is specified.
- cmap
str(default:'Reds') colormap.
- vmax
float|None(default:None) the value representing the upper limit of the color scale.
- vmin
float|None(default:None) the value representing the lower limit of the color scale.
- vcenter
float|None(default:None) the value representing the center of the color scale.
- size_legend_title
str(default:'Fraction of cells\\nin group (%)') title for the size legend.
- color_legend_title
str(default:'LogMean(nUMI)\\nin group') title for the colorbar.
- feature_fontsize
float(default:15) size of the feature names when y-ticks is specified.
- xticks_rotation
float(default:90) rotation of the x-ticks.
- ax
Axes|None(default:None) matplotlib axis.
- figsize
tuple[float,float] (default:(8, 4)) figure size.
- path
str|PathLike[str] |Path|None(default:None) path to save plot.
- filename
str(default:'Dotplot.svg') filename of the plot.
- smallest_dot
float(default:0.0) all expression levels with
dot_minare plotted with this size.- largest_dot
float(default:200.0) all expression levels with
dot_maxare plotted with this size.- show
bool(default:True) return axis
- size_exponent
float(default:1.5) control the increase of dots.
- edge_lw
float(default:0.2) thickness of the dot edges.
- edge_color
str(default:'black') dot edge color.
- dot_min
float|None(default:None) If
None, the minimum dot size is set to 0. If given, the value should be a number between 0 and 1. All fractions smaller than dot_min are clipped to this value.- dot_max
float|None(default:None) If
None, the maximum dot size is set to the maximum fraction value found. If given, the value should be a number between 0 and 1. All Fractions larger than dot_max are clipped to this value.- swap_axes
bool(default:True) swap axis. Default is True to match the 3d dotplot arguments
- rect_height
float|None(default:None) height of the boxes of the features in 3d dotplot
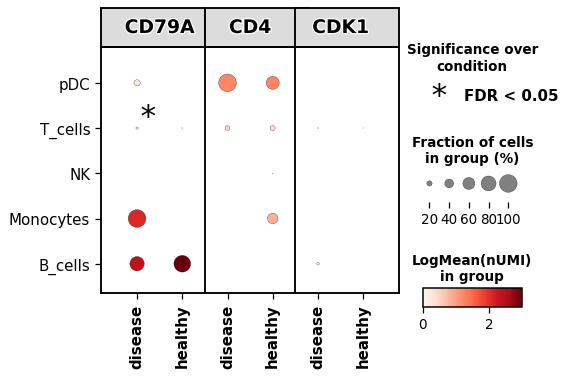
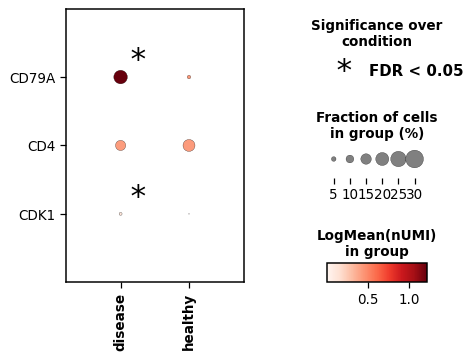
- add_stats
Literal['x_axis','y_axis'] (default:None) add a square to indicate statistical significance. Indicate the x_axis to test for.
- stats_type
Literal['square','star'] (default:'star') how to indicate significance. Square will add a square around the dot, while star will add an asterisk in the top right side of the dotplot.
- df_pvals
DataFrame(default:None) dataframe with significant values. Not yet implemented
- square_x_size
dict(default:None) dictionary specifying the size and thickness of the squares.
- star_x_size
int(default:25) size of the star.
- test
Literal['wilcoxon','t-test'] (default:'wilcoxon') statistical method to use.
- correction_method
Literal['benjamini-hochberg','bonferroni'] (default:'benjamini-hochberg') correction method for multiple testing.
- pval_cutoff
float(default:0.05) cutoff for the p-value.
- log2fc_cutoff
float(default:0.0) cutoff for the log2-foldchange
- set_equal_aspect
bool(default:False) set equal ratio both axis.
- var_group_rotation
int(default:0) if var_names is a dictionary, set the rotation of the labels for each group.
- var_group_offset
float(default:0.75) offset for the labels text in the brackets
- kwargs
additional arguments passed to the Dotplot class
- adata
- Return type:
- Returns:
Depending on
show, returns the plot if set toTrueor a dictionary with the axes
Example
Create a 2d dotplot using a list of markers and a PBMC example dataset grouped by the cell type annotation
import dotools_py as do
adata = do.dt.example_10x_processed()
markers = ['CD79A', 'CD4', 'CDK1']
do.pl.dotplot(adata, 'annotation', markers, figsize=(4, 3))

# Add Statistical significance
do.pl.dotplot(adata, 'condition', markers, figsize=(6, 4), add_stats='x_axis', set_equal_aspect=True)
Create a 3d dotplot grouping also by condition
do.pl.dotplot(adata, 'condition', markers, 'annotation', figsize=(6, 4))

# Add Statistical significance for groups with pvals < 0.05 and log2fc > 0.0
# Note, the object is quite small, some groups cannot be tested for having one condition only.
do.pl.dotplot(adata, 'condition', markers, 'annotation', figsize=(6, 4), add_stats='x_axis', set_equal_aspect=True)