dotools_py.pl.slides#
- dotools_py.pl.slides(adata, color, batch_key='batch', ncols=4, sp_size=1.5, path=None, filename='Spatial.svg', common_expr='p99.2', order=None, figsize=(15, 8), layer=None, img_key='hires', title_fontsize=15, title_fontweight=None, library_id=None, select_samples=None, show=True, minimal_title=True, vmax=None, verbose=True, spacing=(0.3, 0.2), **kwargs)[source]#
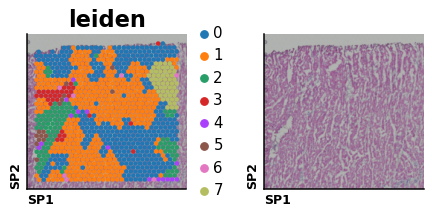
Plot visium slides.
Plot a feature in var_names or a column from obs in one or multiple visium slides.
- Parameters:
- adata
AnnData annotated data matrix.
- color
str|list var_names or obs column to plot. When multiple slides are available in the object, provide one feature.
- batch_key
str(default:'batch') obs column containing Batch/Sample Information. This column should have the same names system use to save the spatial images in
adata.uns['spatial'].keys().- ncols
int(default:4) number of subplots per row.
- sp_size
float(default:1.5) size of the dots.
- path
str|PathLike[str] |Path(default:None) path to save the plot.
- filename
str(default:'Spatial.svg') filename of the plot.
- common_expr
str|float|None(default:'p99.2') specify a float or a string in the form of ‘p99.2’ (percentile 99.2) to normalize expression for continuous values across multiple slides.
- order
list(default:None) provide a list with the order of the slides to show. If not set the
batch_keywill be sorted.- figsize
tuple(default:(15, 8)) size of the subplots.
- layer
str(default:None) layer to use to plot dt. If not specified,
.Xwill be used.- img_key
str(default:'hires') image key to use for plotting (hires or lowres).
- title_fontsize
int(default:15) fontsize of the title for the subplots.
- title_fontweight
str(default:None) change fontweight of the title.
- library_id
str(default:None) Name of the key in adata.uns[‘spatial’] containing the image information.
- select_samples
list|str(default:None) list with a subset of samplename that want to be plotted.
- show
bool(default:True) if False, return axs.
- minimal_title
bool(default:True) if set to true only the sample name will be shown as title, otherwise title + color
- vmax
float(default:None) maximum value for continuous values (e.g., expression). If common expression is set to True and vmax is not specified, it will be automatically computed taking the p99.2 expression value across all subplots.
- verbose
bool(default:True) show a progress bar when plotting multiple slides.
- kwargs
additional arguments for the function
scanpy.pl.spatial().- spacing
tuple(default:(0.3, 0.2)) spacing between subplots (height, width) padding between plots
- adata
- Return type:
- Returns:
a matplotlib axes object
Examples
import dotools_py as do
adata = do.dt.example_visium_processed()
do.pl.slides(adata, ["leiden", None], img_key="lowres", figsize=(5,5))