dotools_py.pl.ora_network#
- dotools_py.pl.ora_network(df, term_key, pval_key, score_key, genes_key, color_key=None, shape_key=None, figsize=(6, 5), palette='tab30', title=None, title_fontproperties=None, ax=None, legend_title=None, legend_properties=None, legend_ncols=1, legend_loc='center left', path=None, filename='Network.svg', show=True, shapes=None, clustering_algorithm='hierarchical', cluster_method='complete', cluster_threshold=0.7, cluster_resolution=1, cluster_criterion='distance', min_cluster_size=3, nx_layout=<function spring_layout>, nx_layout_kwargs=None, labels_fontproperties=None, edge_color='gray', edge_alpha=0.75, textwrap_width=25)[source]#
Similarity network of overrepresentation analysis results.
Construct a network in which each node represents an enriched term and edges connect terms that share similar gene sets. Term similarity is computed from the overlap of the genes associated with each term and is used to cluster the network and determine the graph layout. Node size is scaled according to the provided score.
- Parameters:
- df
DataFrame Pandas dataframe with ora results.
- term_key
str Column in the dataframe with the term.
- pval_key
str Column in the dataframe with the p-values. After clustering the most significant term in each group will be selected as the representative.
- score_key
str Column in the dataframe with the score. This is used to determine the node size.
- genes_key
str Column in the dataframe with the genes associated to the term. Needs to be a string with genes comma, or semicolon separated.
- color_key
str|None(default:None) Column in the dataframe with a first category to be used to determine the node color.
- shape_key
str|None(default:None) Column in dataframe with a second category to be used to determine the shape of the nodes.
- figsize
tuple(default:(6, 5)) Figure size, the format is (width, height).
- palette
str|dict(default:'tab30') String denoting matplotlib colormap. If not set, it will try to access
adata.uns[hue_colors | x_axis_colors], if not the colormapdo.utility.tab30()will be used. A dictionary with the categories available inadata.obs[x_axis]oradata.obs[hue]if hue is not None can also be provided. The format is {category:color}.- title
str|None(default:None) Title for the figure.
- title_fontproperties
Optional[Dict[Literal['size','weight'],str|int]] (default:None) Dictionary which should contain ‘size’ and ‘weight’ to define the fontsize and fontweight of the title of the figure.
- ax
Axes|None(default:None) Matplotlib axes to use for plotting. If not set, a new figure will be generated.
- legend_title
str|None(default:None) Title for the legend.
- legend_properties
Optional[Dict[Literal['size','weight'],str|int]] (default:None) Dictionary which should contain ‘size’ and ‘weight’ to define the fontsize and fontweight of the title of the legend.
- legend_ncols
int(default:1) Number of columns for the legend.
- legend_loc
Literal['center left','cemter right','upper right','upper left','lower left','lower right','right','lower center','upper center','center'] (default:'center left') Location of the legend.
- path
str|PathLike[str] |Path|None(default:None) Path to the folder to save the figure.
- filename
str(default:'Network.svg') Name of file to use when saving the figure.
- show
bool(default:True) If set to
False, returns a dictionary with the matplotlib axes.- shapes
dict|None(default:None) Dictionary indicating the marker shape to use for each category in shape_key. The key is a category in df[shape_key] and the value is a valid matplotlib marker
- clustering_algorithm
Literal['hierarchical','louvain','connected_components'] (default:'hierarchical') Algorithm to use to cluster the terms.
- cluster_method
str(default:'complete') Linkage method to use for calculating clusters.
- cluster_threshold
float(default:0.7) depending on the criterion define the threshold to apply when forming flat clusters or specify the max number of clusters.
- cluster_criterion
str(default:'distance') Criterion to form flat clusters using fcluster
- cluster_resolution
float(default:1) Resolution to use when
cluster_algorithmis set tolouvain.- min_cluster_size
int(default:3) Keep terms present in clusters of at least this number of terms.
- nx_layout
Any(default:<function spring_layout at 0x7b35297fbb00>) A valid networkx layout.
- nx_layout_kwargs
Optional[Dict] (default:None) Additional arguments to pass to the network layout.
- labels_fontproperties
Optional[Dict[Literal['size','weight'],str|int]] (default:None) Fontsize for the representative terms in each cluster.
- edge_color
str(default:'gray') Color of the edges.
- edge_alpha
float(default:0.75) Alpha value for the edges.
- textwrap_width
int(default:25) The maximum width to use when wrapping text.
- df
- Returns:
Depending on
show, returns the plot if set toTrueor a dictionary with the axes
Example
Create a network with the results of ORA
import dotools_py as do
table_go = do.dt.example_ora()
table_go = table_go[table_go['Adjusted P-value'] < 0.2]
table_go["Term"] = table_go["Term"].str.split("\(G").str[0]

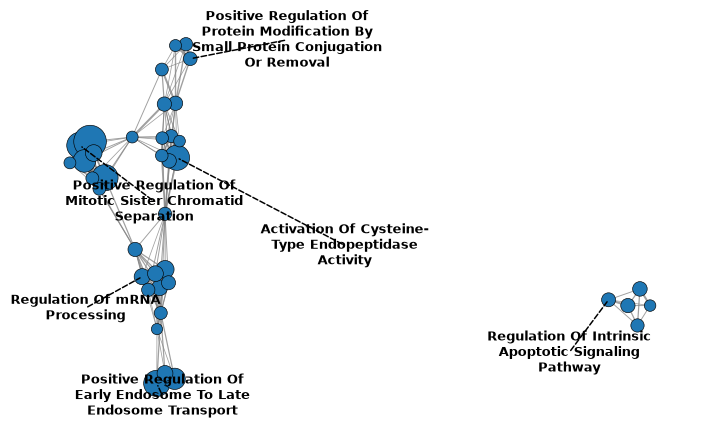
# Network with only the enriched terms
do.pl.ora_network(
    table_go[table_go["state"] == "enriched"], term_key="Term",
    pval_key="Adjusted P-value", score_key="Combined Score", genes_key="Genes", figsize=(10, 6),
    min_cluster_size=5
)
Create a network and color by a categorical column
table_go = table_go[table_go['Adjusted P-value'] < 0.15]

do.pl.ora_network(
    table_go, term_key="Term", color_key="state", shape_key="state",
    pval_key="Adjusted P-value", score_key="Combined Score", genes_key="Genes", figsize=(10, 6),
    min_cluster_size=2, palette={"enriched":"firebrick", "depleted":"royalblue"},
    clustering_algorithm="louvain", nx_layout_kwargs={"k":0.5}, edge_alpha=0.75,
)  # Keep clusters with at least 2 terms