dotools_py.pl.ridgeplot#
- dotools_py.pl.ridgeplot(adata, group_by, feature, layer=None, figsize=(6, 5), ax=None, title=None, title_fontproperties=None, palette=None, x_linspace=500, alpha=1, x_label='Log(nUMI)', add_y_ticks=True, catgs_order=None, reference=None, groups=None, groups_pvals=None, test='wilcoxon', corr_method='benjamini-hochberg', txt='p = ', txt_size=10, path=None, filename='Ridgeplot.pdf', show=True, bw_adjust=0.5, bw_method='scott', ridge_height=0.8, ridge_spacing=0.6)[source]#
Ridgeplot for AnnData.
Represent in a ridgeplot the expression of a feature in
adata.var_namesor a continuous metadata inadata.obs.- Parameters:
- adata
AnnData Annotated data matrix.
- group_by
str Column in
adata.obsto group in the Y axis.- feature
str Valid key in
adata.var_namesor continuous metadata inadata.obs.- layer
str(default:None) Layer in
adata.layersto use.- figsize
tuple[int,int] (default:(6, 5)) Figure size, the format is (width, height).
- ax
Axes(default:None) Matplotlib axes to use for plotting. If not set, a new figure will be generated.
- title
str(default:None) Title for the figure.
- title_fontproperties
Dict[Literal['size','weight'],str|int] (default:None) Dictionary which should contain ‘size’ and ‘weight’ to define the fontsize and fontweight of the title of the figure.
- palette
str|dict(default:None) Can be the name of a valid matplotlib colormap or a dictionary of the groups as keys and the colors as values. If set to
Nonewill extract the colors fromadata.uns[group_by_colors]- x_linspace
int(default:500) Number of points to generate for the x-axis.
- alpha
float(default:1) Transparency level of the object, where 0 is fully transparent and 1 is fully opaque.
- x_label
str(default:'Log(nUMI)') Name of the X axis label.
- add_y_ticks
bool(default:True) If set to
Truethe groups will be shown in the y-ticks, otherwise the Y-axis is removed and the labels are displayed inside the plot.- catgs_order
list(default:None) order for the categories in
adata.obs[group_by]- reference
str(default:None) Reference condition to use when testing for significance.
- groups
str|list(default:None) List of the name of the groups to test against.
- groups_pvals
list(default:None) If provided, these values will be plotted. If not set, the p-values will be estimated. The order of the p-values should match the order of the
groups_condcategories.- test
Literal['wilcoxon','t-test','kruskal','anova','logreg','t-test_overestim_var'] (default:'wilcoxon') Name of the method to test for significance.
- corr_method
Literal['benjamini-hochberg','bonferroni'] (default:'benjamini-hochberg') Correction method for multiple testing.
- txt
str(default:'p = ') Text to include before the p-value. If not set, only the p-value is shown.
- txt_size
int(default:10) Font size of the text indicating significance.
- path
str|PathLike[str] |Path(default:None) Path to the folder to save the figure.
- filename
str(default:'Ridgeplot.pdf') Name of file to use when saving the figure.
- show
bool(default:True) If set to
False, returns a dictionary with the matplotlib axes.- bw_adjust
float(default:0.5) Factor that multiplicatively scales the value chosen using
bw_method. Increasing will make the curve smoother.- bw_method
str(default:'scott') Method for determining the smoothing bandwidth to use; passed to scipy.stats.gaussian_kde.
- ridge_height
float(default:0.8) Scaling factor controlling the ridge height.
- ridge_spacing
float(default:0.6) Distance between consecutive ridges.
- adata
- Return type:
- Returns:
Depending on
show, returns the plot if set toTrueor a dictionary with the axes.
Example
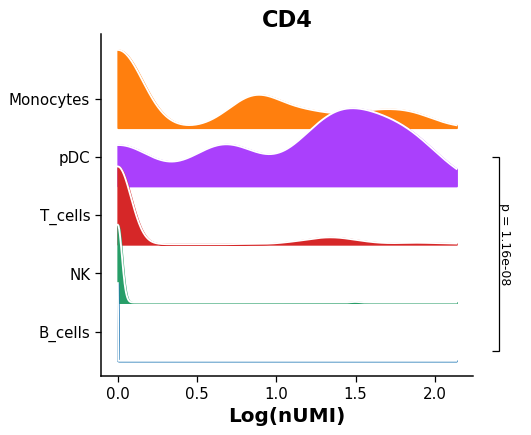
Create a ridgeplot showing the expression of a given gene including the p-value to indicate if there is a significant statistical difference between groups.
import dotools_py as do
adata = do.dt.example_10x_processed()
do.pl.ridgeplot(adata,  'annotation', 'CD4', reference = 'pDC', groups=['B_cells'])
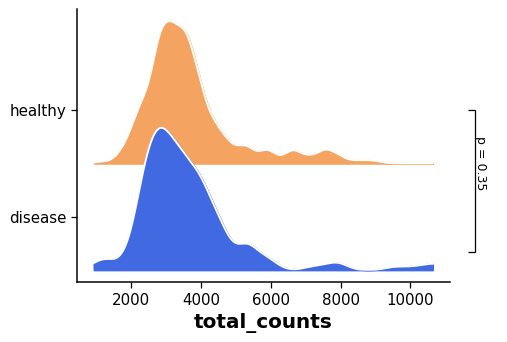
Plot a continuous value in
adata.obs.do.pl.ridgeplot(adata,'condition','total_counts', reference = 'healthy', groups=['disease'], figsize=(6, 4), x_label="total_counts", title="", palette={"healthy":"sandybrown", "disease":"royalblue"})