dotools_py.pl.density#
- dotools_py.pl.density(adata, color, figsize=(6, 5), ax=None, ncols=4, cmap='Reds', palette=None, show=True, vmax=None, vmin=None, vcenter=None, color_legend_title=None, density_legend_title=None, path=None, filename='Density.pdf', basis='spatial', show_basis=True, density_alpha=0.75, density_bw_adjust=0.5, fill=True, gridsize=200, kwargs_kde=None, **kwargs)[source]#
Density plot.
- Parameters:
- adata
AnnData Annotated data matrix.
- color
str|list Value in adata.var_names or column name in adata.obs
- figsize
tuple[float,float] (default:(6, 5)) Figure size, the format is (width, height)
- ax
Axes(default:None) Matplotlib axes.
- ncols
int(default:4) Number of columns per row when multiple values are plotted.
- cmap
str(default:'Reds') String denoting matplotlib color map.
- palette
dict(default:None) Colors to use for plotting categorical annotation groups in dictionary format with group as key and color as the value. If
None, categorical variable with already colors stored in adata.uns[“{var}_colors”] will be used.- show
bool(default:True) If set to
False, returns a dictionary with the matplotlib axes.- vmax
int|str(default:None) The value representing the upper limit of the color scale.
- vmin
int|str(default:None) The value representing the lower limit of the color scale.
- vcenter
int|str(default:None) The value representing the center of the color scale.
- color_legend_title
str(default:None) Title of the colorbar legend
- density_legend_title
str(default:None) Title of the colorbar for the density
- path
str|PathLike[str] |Path(default:None) Folder where the figure is saved.
- filename
str(default:'Density.pdf') Name of the file.
- basis
str(default:'spatial') Embedding to use, default spatial.
- show_basis
bool(default:True) If set to
Trueboth the density and the scatterplot for the embedding will be shown.- density_alpha
float(default:0.75) Transparency for the density kernel.
- density_bw_adjust
float(default:0.5) Factor that multiplicatively scales the value chosen using bw_method. Increasing will make the curve smoother.
- fill
bool(default:True) If
True, fill in the area under univariate density curves or between bivariate contours.- gridsize
int(default:200) Number of points on each dimension of the evaluation grid. A smaller number mights speed up plot generation.
- kwargs_kde
dict(default:None) Additional arguments pass to sns.kdeplot
- kwargs
Additional arguments pass to dotools_py.pl.embedding.
- adata
- Return type:
- Returns:
Depending on
show, returns the plot if set toTrueor a dictionary with the axes.
Examples
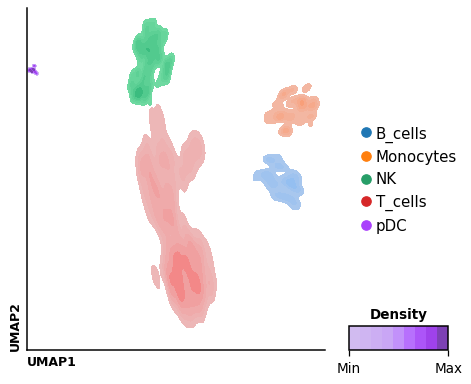
Visualize a categorical column
import dotools_py as do
adata = do.dt.example_10x_processed()
do.pl.density(adata, 'annotation', basis="X_umap", density_alpha=1, show_basis=False)
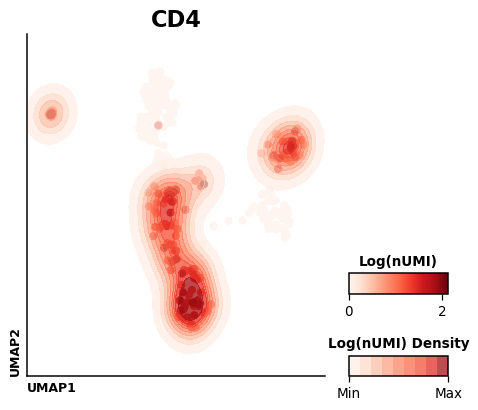
or the expression of a gene
do.pl.density(adata, 'CD4', basis="X_umap", density_alpha=.75)